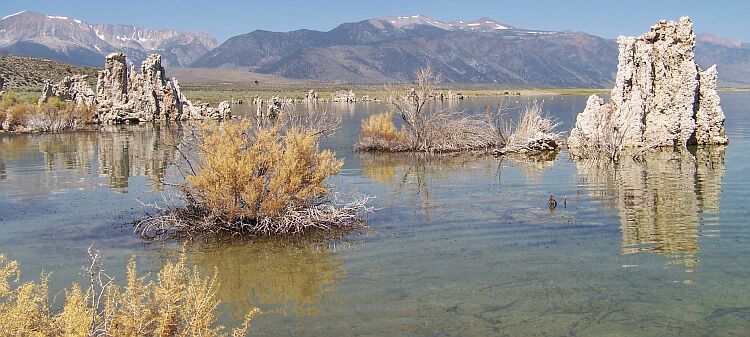
This was once under water.
When calcium-rich springs flow up through the lake bottom, the
calcium bonds to carbonates in the lake water. Together they form
calcium carbonate, a type of limestone. This solid material builds
on itself, gradually forming a tufa tower. When the lake level
drops, the exposed tufa stops growing.

 California’s Mono Lake is a prime example for the
detrimental influence of human population on ecosystems, but
also an example of growing awareness and an attempt to right
the wrongs of the past. The lake has endured at least 760,000
years of dramatic geologic history. However, within the last
100 years, human demands have posed the greatest threat to its
continued health and existence.
California’s Mono Lake is a prime example for the
detrimental influence of human population on ecosystems, but
also an example of growing awareness and an attempt to right
the wrongs of the past. The lake has endured at least 760,000
years of dramatic geologic history. However, within the last
100 years, human demands have posed the greatest threat to its
continued health and existence.
In 1941, the Los Angeles Department of Water and Power (LADWP)
began diverting water from Mono’s tributary streams. During the
next 40 years, lake salinity nearly doubled; stream and waterfowl
habitat disappeared, and large alkali flats emerged as the lake
lost half its volume. A declining ecosystem, increasing dust
storms, and dwindling waterfowl populations began to raise concern.
In 1978, the Mono Lake Committee formed to educate the public about
the plight of Mono Lake and to search for solutions to the
problem.
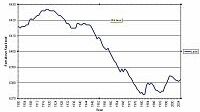
Mono
Lake Level
Click thumb for larger picture
|
Education and a growing
awareness of Mono Lake’s plight led to an organized effort to
reduce its decline. Individuals, environmental groups, government
agencies and LADWP became involved in a long, controversial
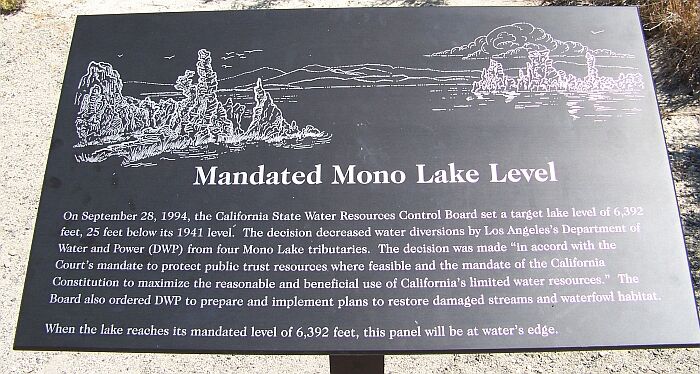
struggle over Mono Lake’s water. In 1994, the California State
Water Recourses Control Board decided that Mono Lake will be
maintained
at an elevation of 6392 feet – 20 feet above its historic low
in 1982, but still 25 feet below the 1941 lake level. Diversions
will continue in the Mono Lake Basin, but at a reduced rate, which
will allow the lake level to rise. |
|
We talked to rangers at
the South Tufa Area and the Mono Lake Visitor’s Center. There are
tons of tables and diagrams, documenting the lake level (the
current levels can be found here), but
apparently nobody has been taking pictures from the same location
to create visual evidence of the change for the better. Both
rangers though a picture documentation would be a great idea.
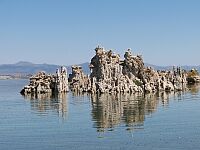
Mono Lake, Aug. 13, 2006
Click thumbnail for larger pictures. |
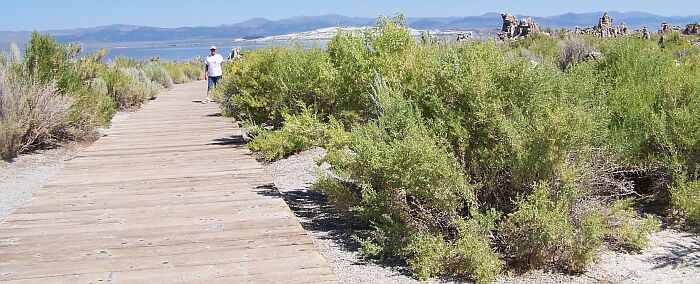
So, this is your task. Go
to the above location at the south coast of the lake (South Tufa
Area) or (if it is already under water) as close as possible to it
and take a picture facing the mountains, showing the shoreline of
the lake. (As close as possible to the one shown to the
right.)
Once the lake has reached its final level, the collection of
pictures will be presented to the Mono Lake Visitors Center.
Mono Lake, Aug. 13, 2006. Click thumbnail for
larger pictures. |
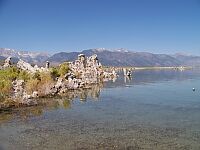
|
This is where the lake level is going to be at the end of its
restauration
Logging requirements:
Send me a note with :
- The text "GC1D4XB Mono Lake Water Balance" on the first
line
- The number of people in your group.
- Take pictures at the above location showing the shoreline of
the lake. Try to be as similar as possible to the pictures posted
at this site. If you are using the alternate coordinates take a
picture at the begining of the boardwalk toward the lake with the
boardwalk in the middle of the picture. (if you have a camera)
- While staying on the boardwalk, go down to where the water is
located and post the coordinates.
- Using the coordinates from a post about a year earlier than
your visit, calculate the distance per day that the water is
refilling the lake use the formula of (distance between your
coordiantes and the prior coordinates divided by the number of
days)
- Overachivers can figure out the difference in height and
calculate that rate.
- Super overachievers can determine the volume of water that has
filled the lake and figure out that rate<>
Thanks to the Bernd das Brot Team for letting me revive this
earthcache.